
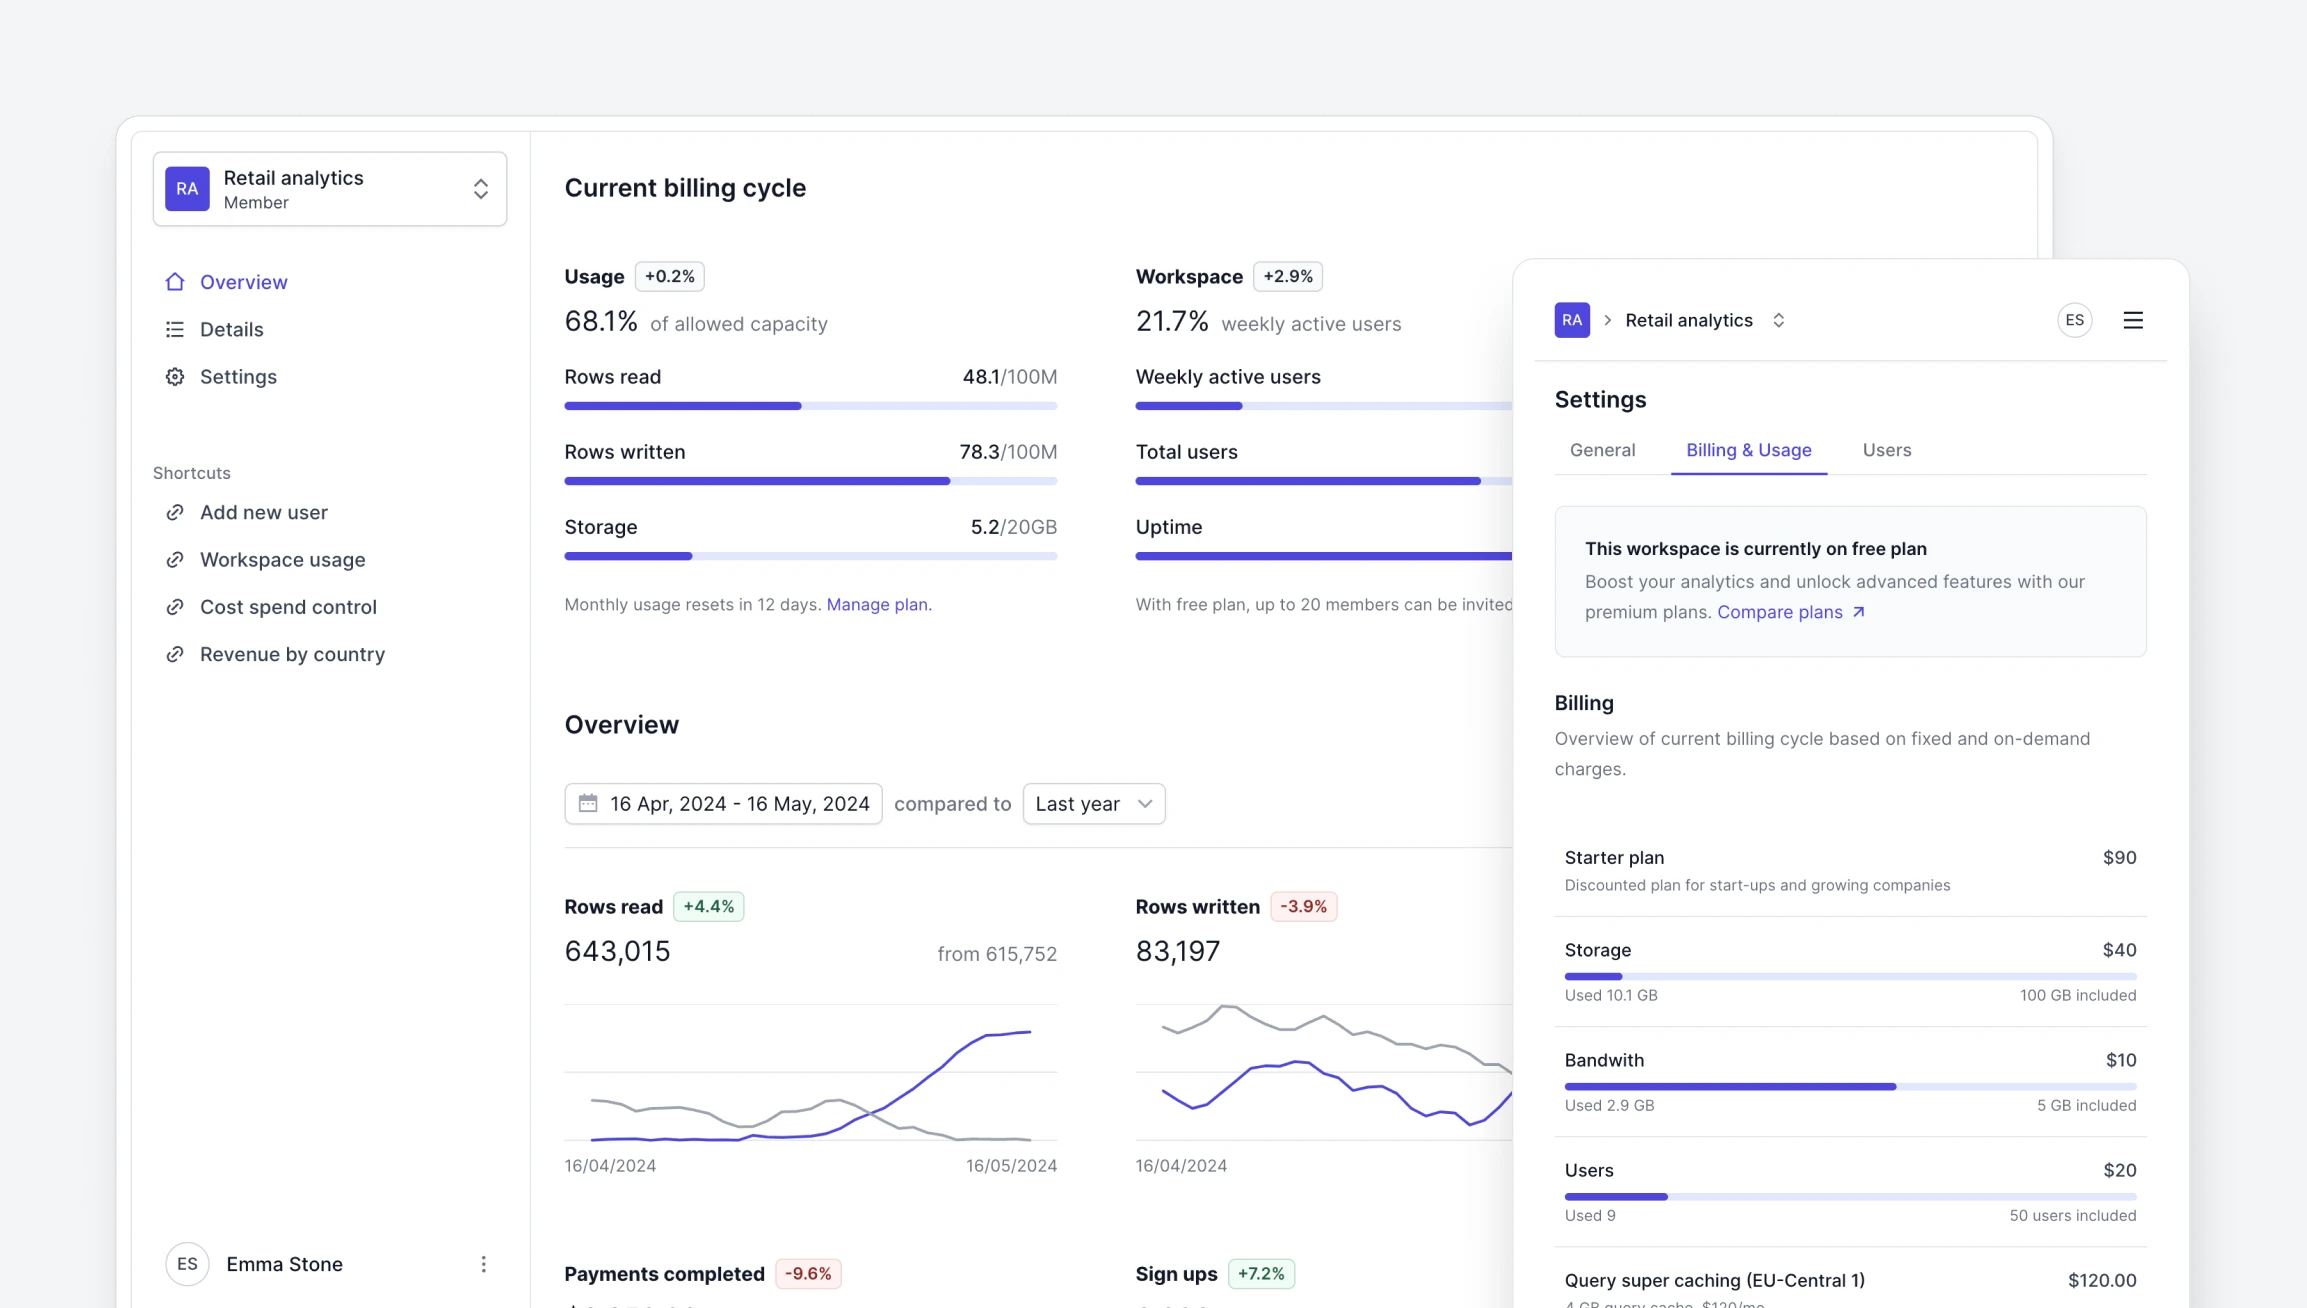
React components to build charts and dashboardsReact components to build dashboards
35+ fully open-source, accessible components for dashboards and charts.
Built with React, Tailwind CSS and Radix UI.35+ fully open-source, accessible components for dashboards and charts. Built with React, Tailwind CSS and Radix UI.
Portfolio Value
$25.00
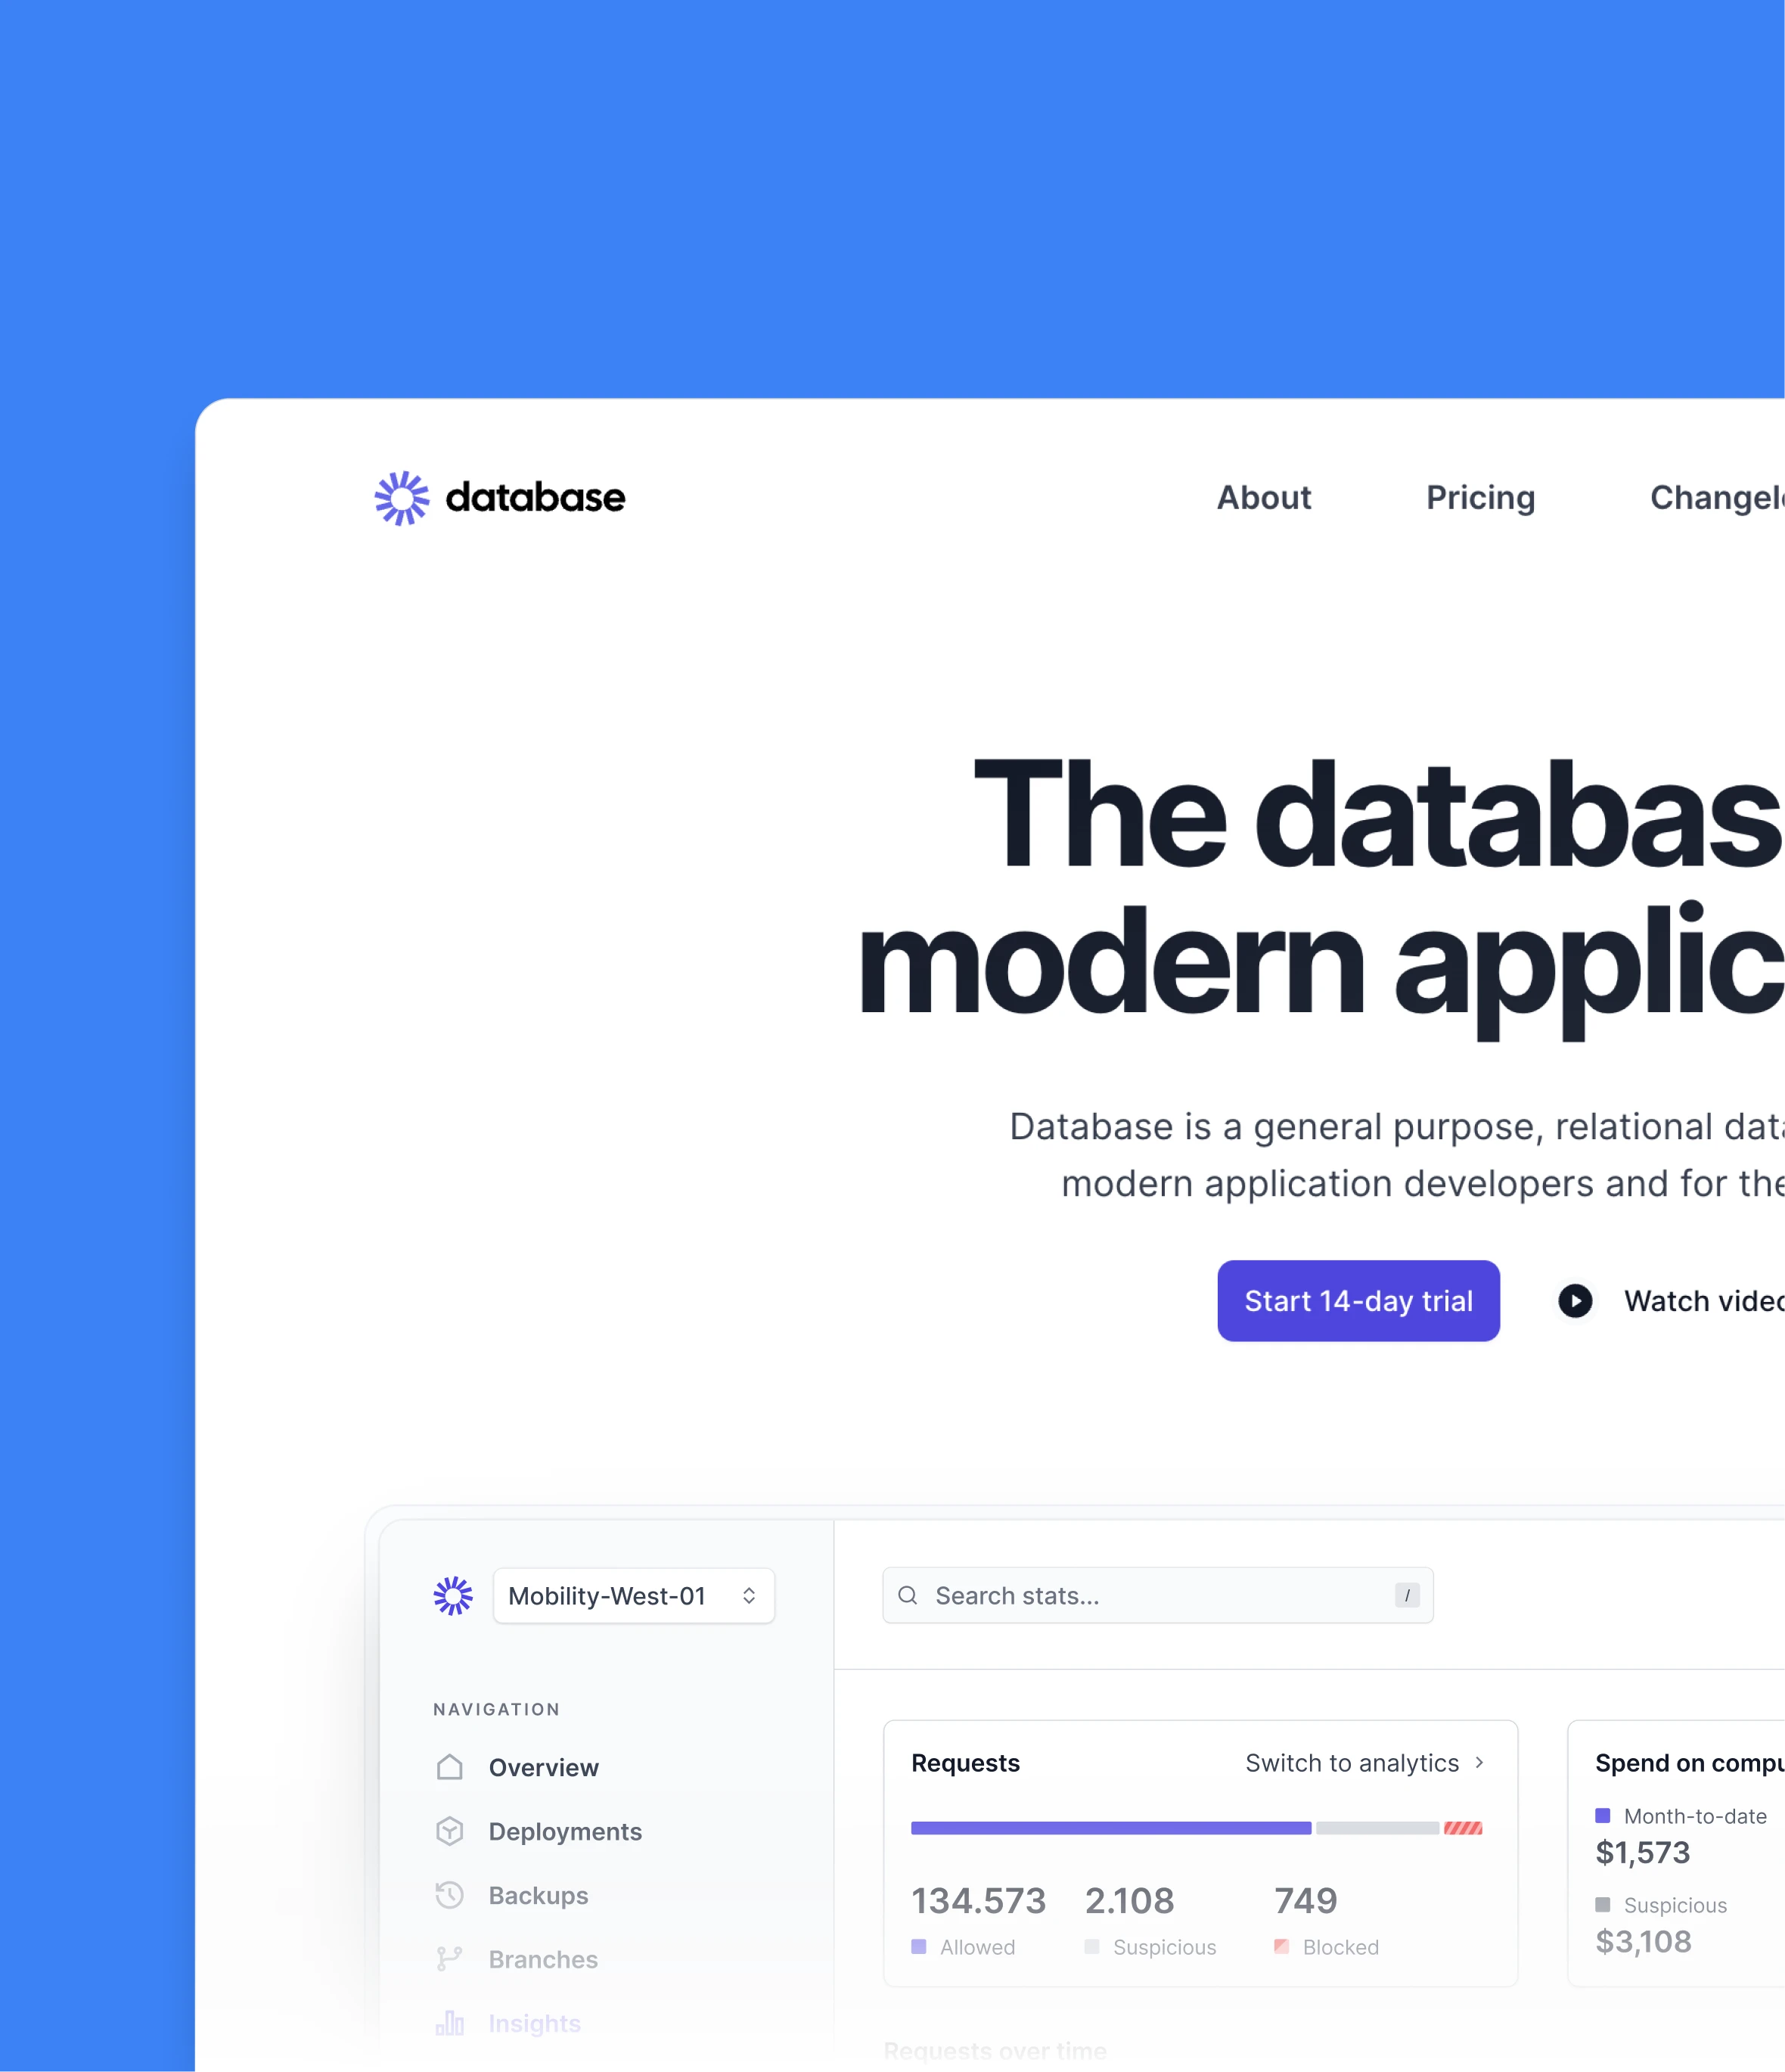
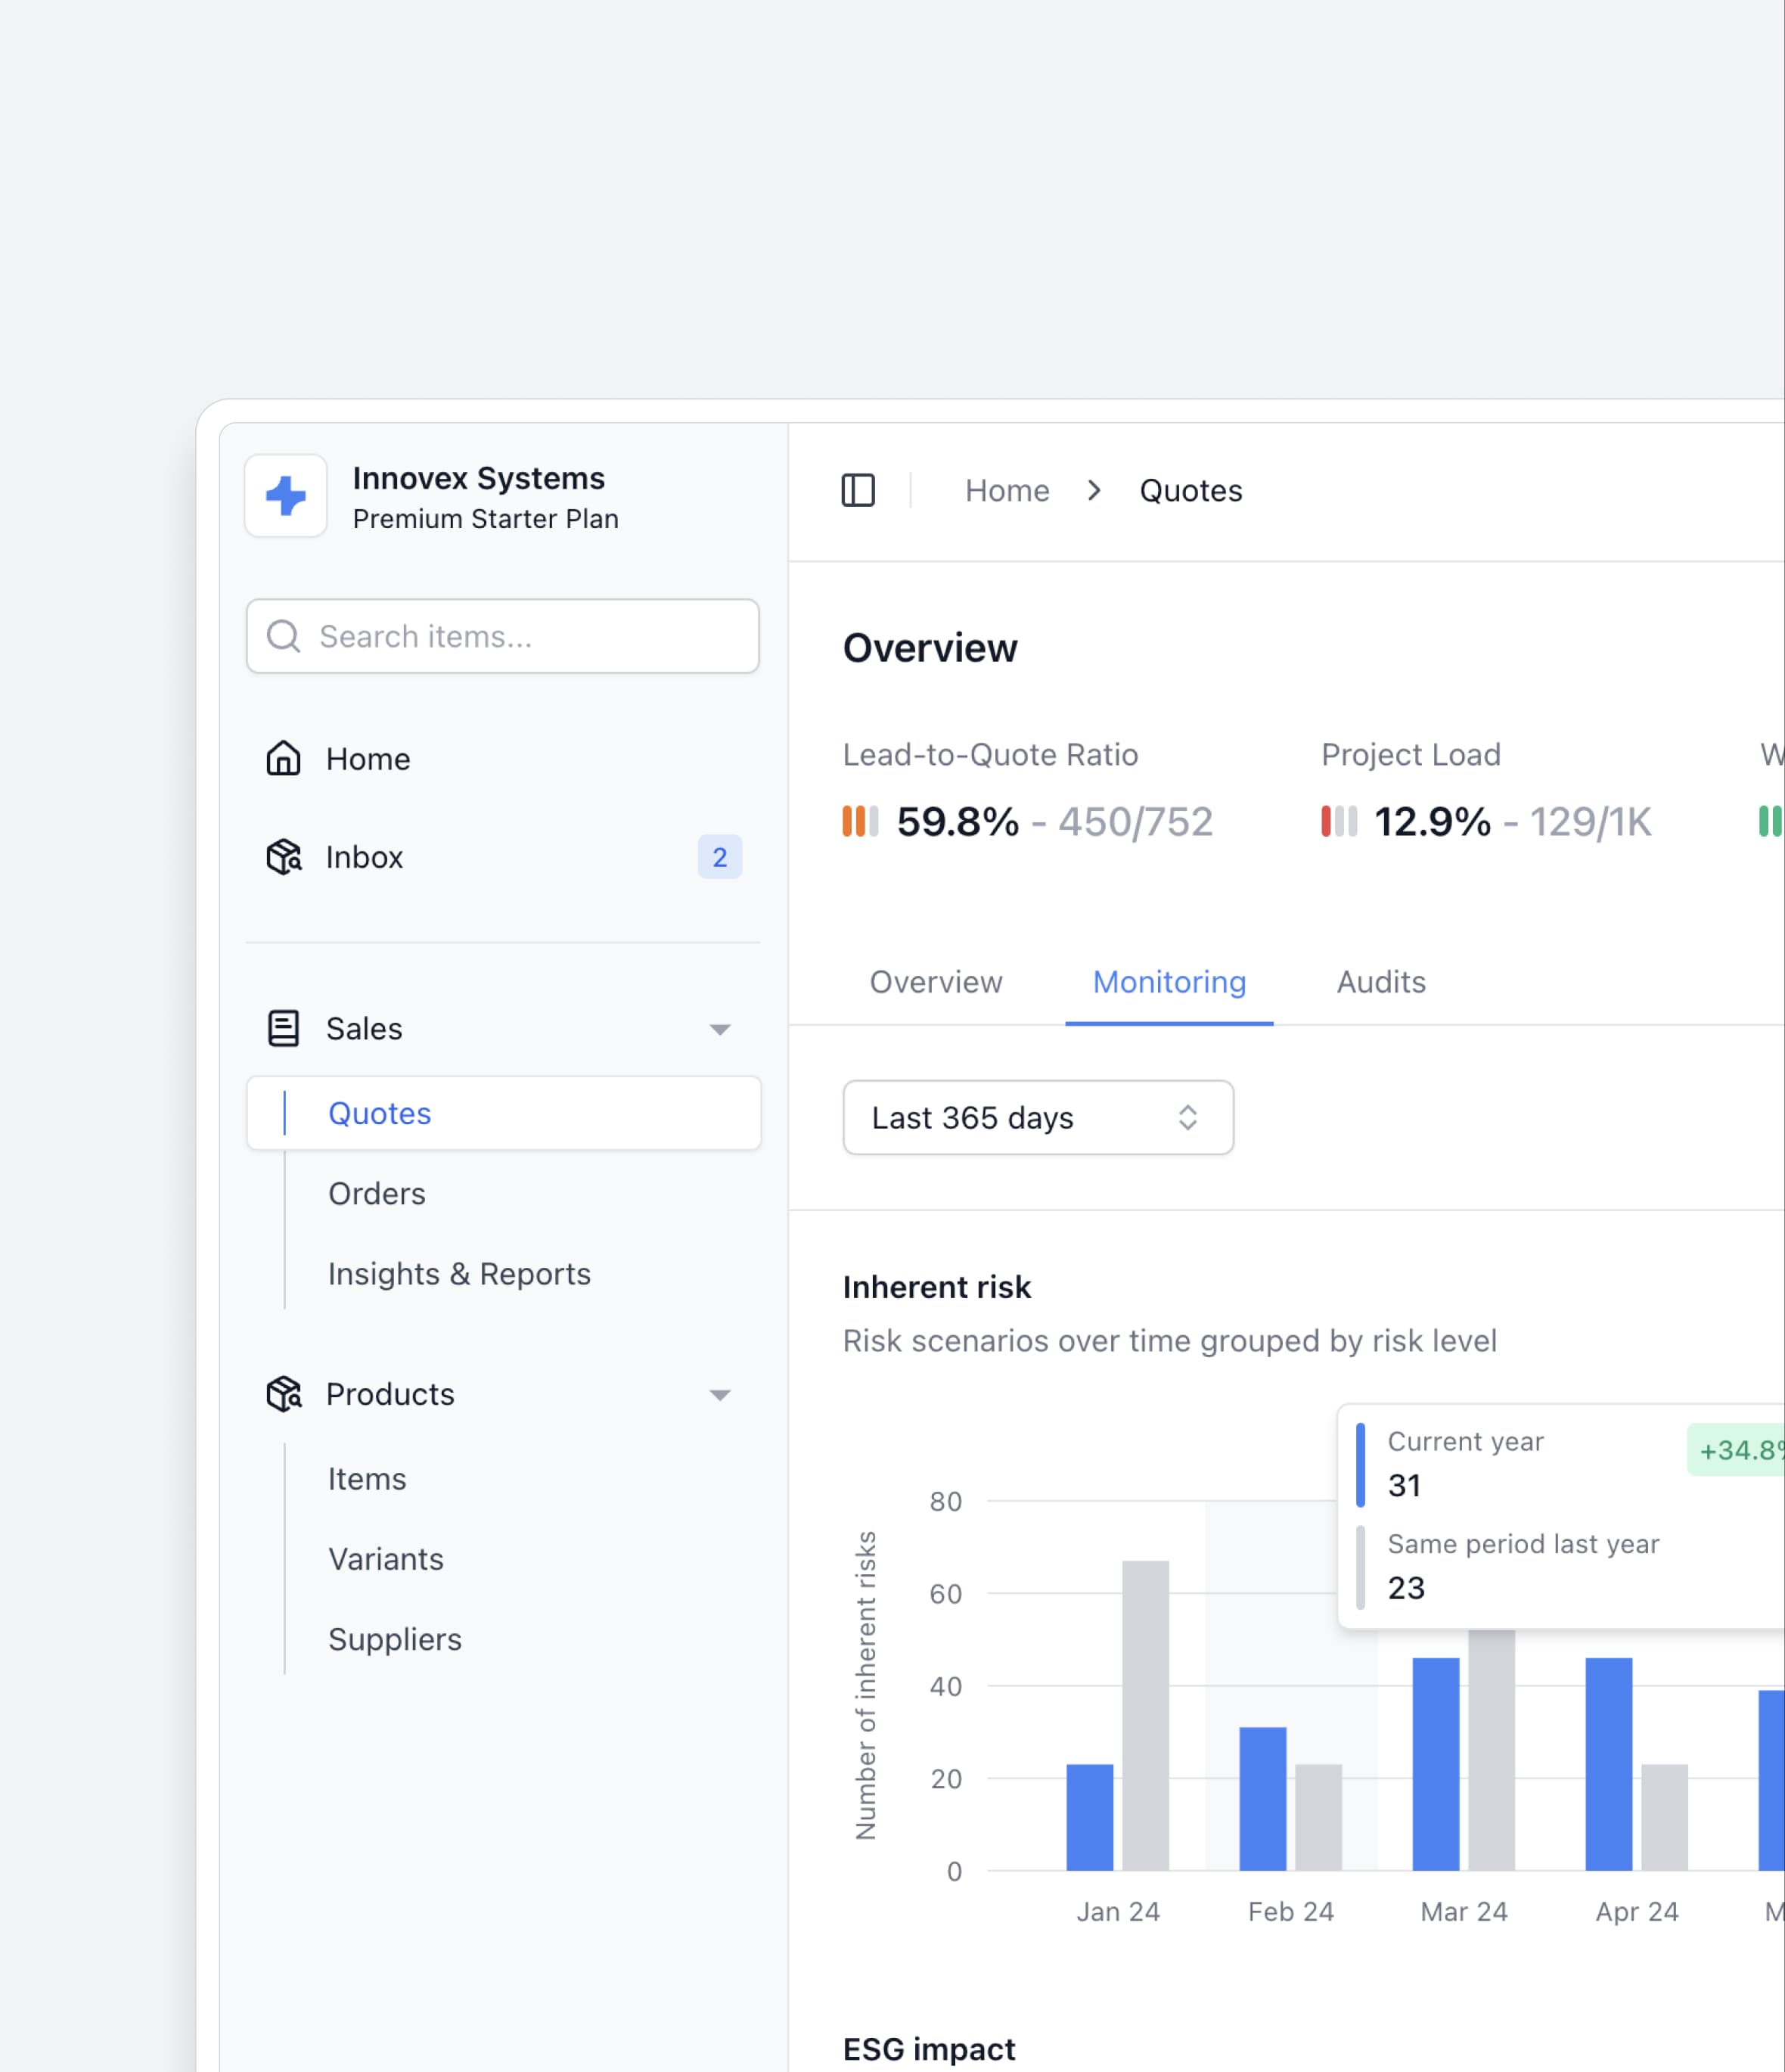
Beautiful defaults, and simple props for every component
We already pushed the pixels so that you can focus on data. Customize quickly, spend less time on design.
Online payments
- Successful263
- Refunded18
- Fraudulent9
Accessible by design
Built on Recharts and Radix UI, Tremor provides the essentials for production-ready UI.
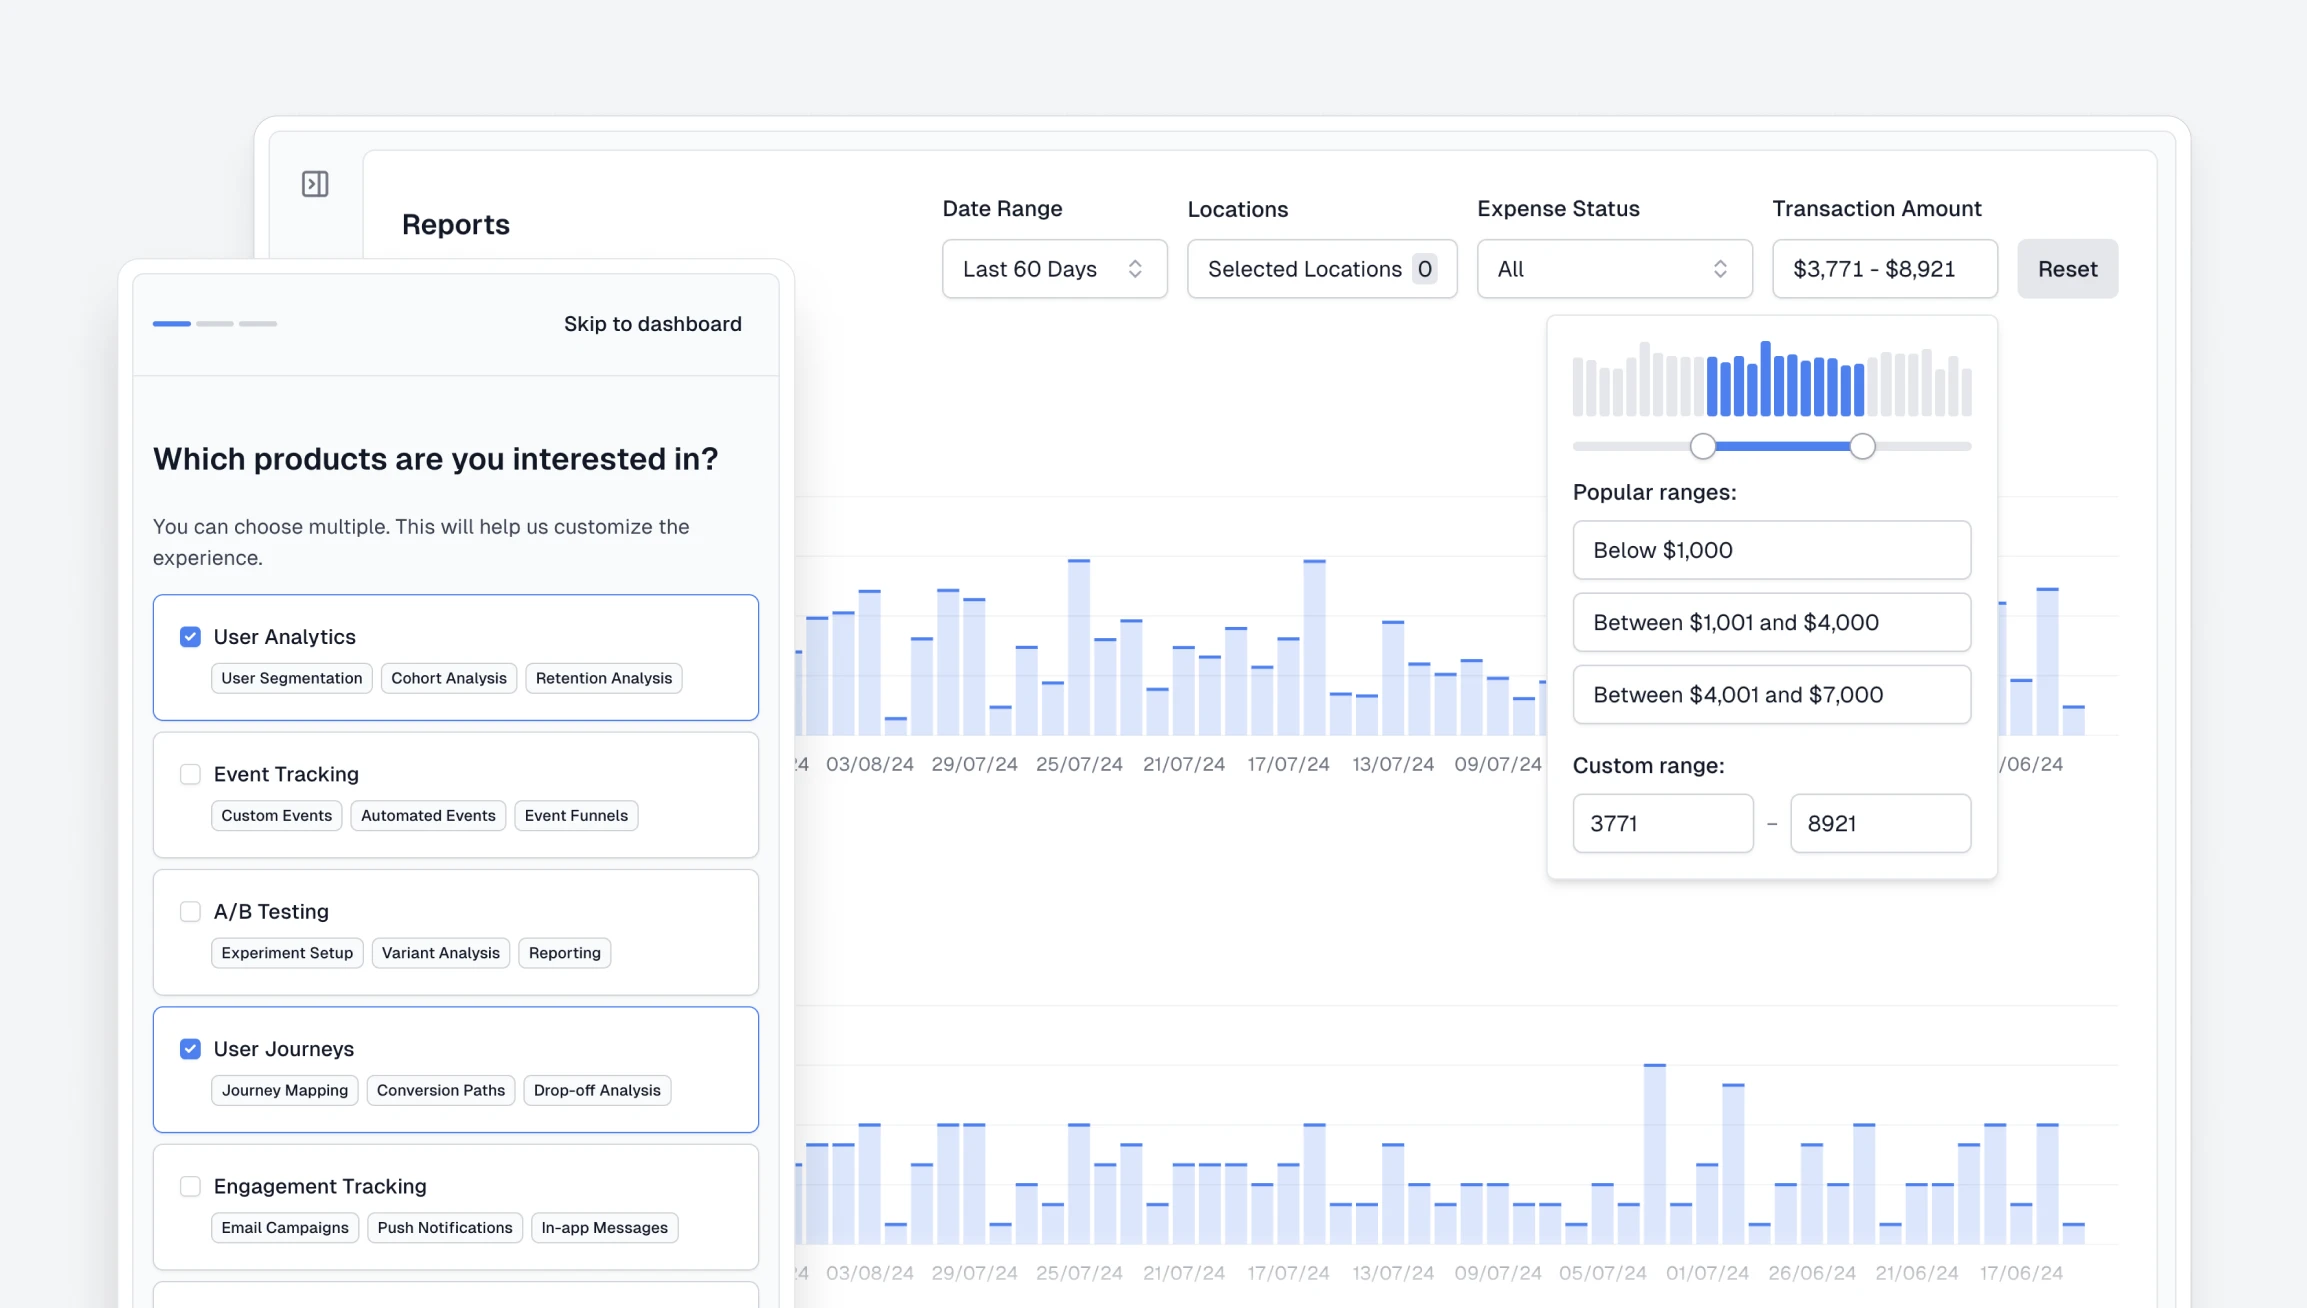
Build the most complex filters
Modular input components for better interaction with your data, with full support for keyboard navigation.
example.com
99.9% uptime
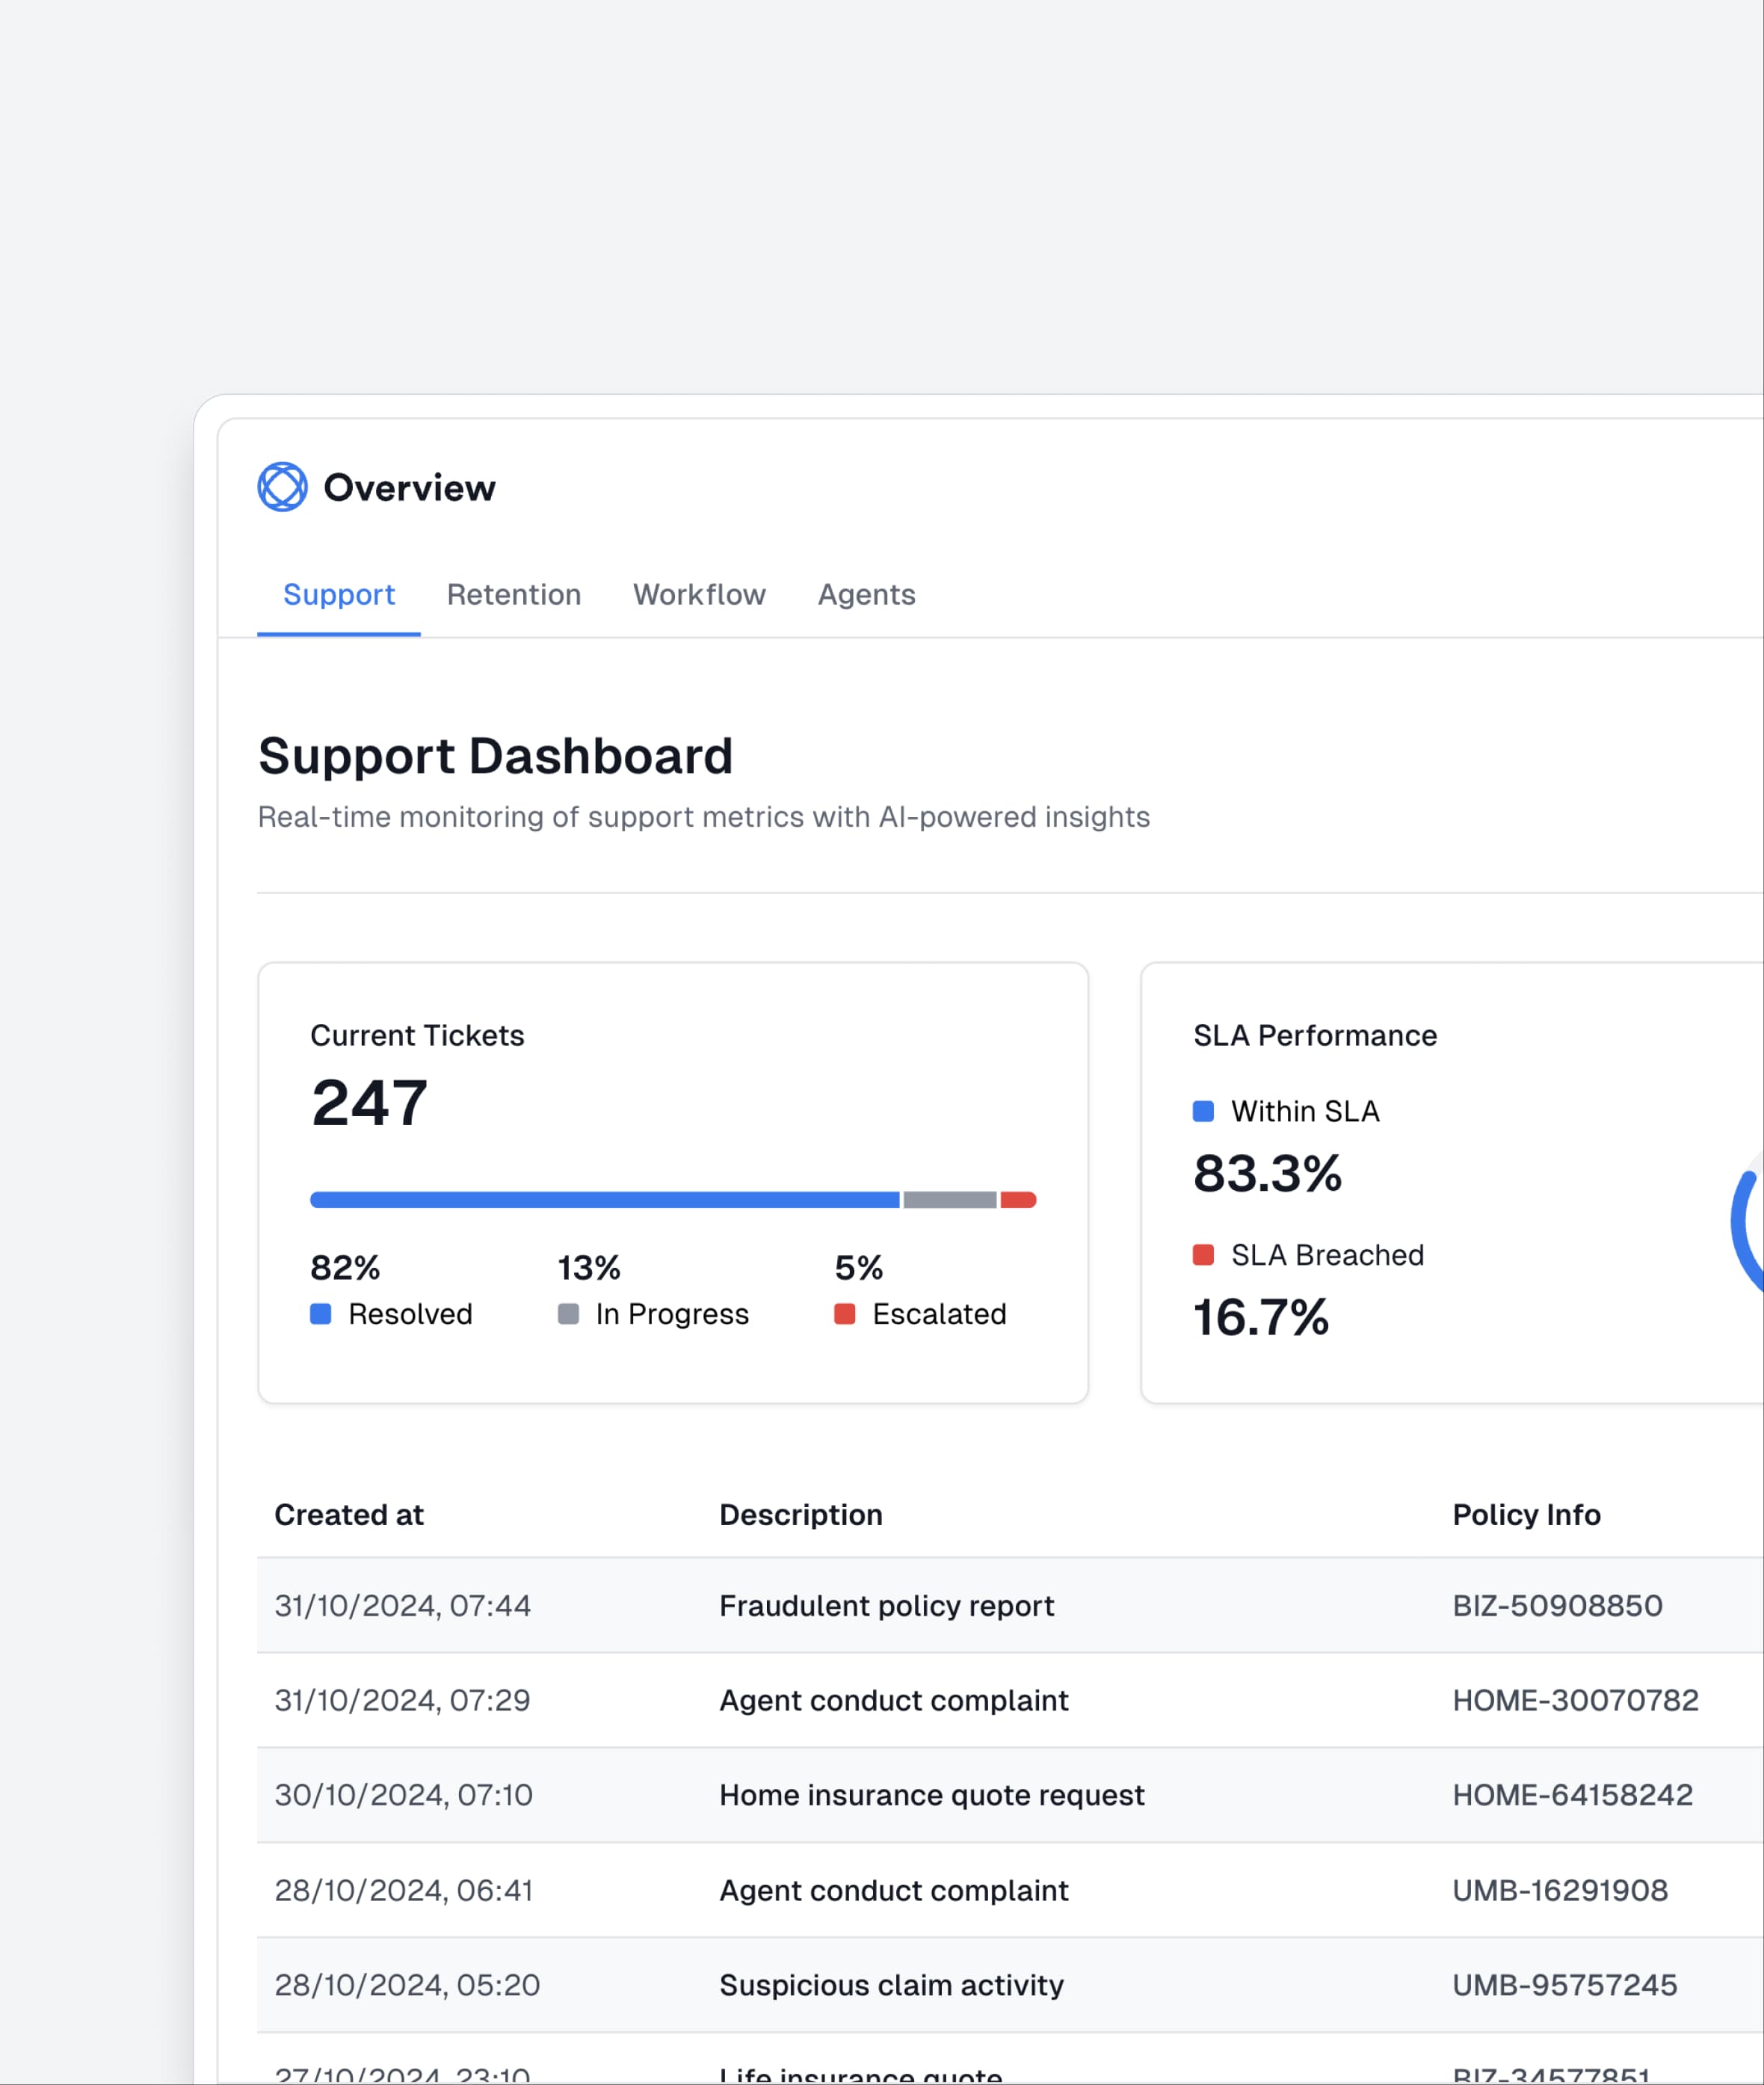
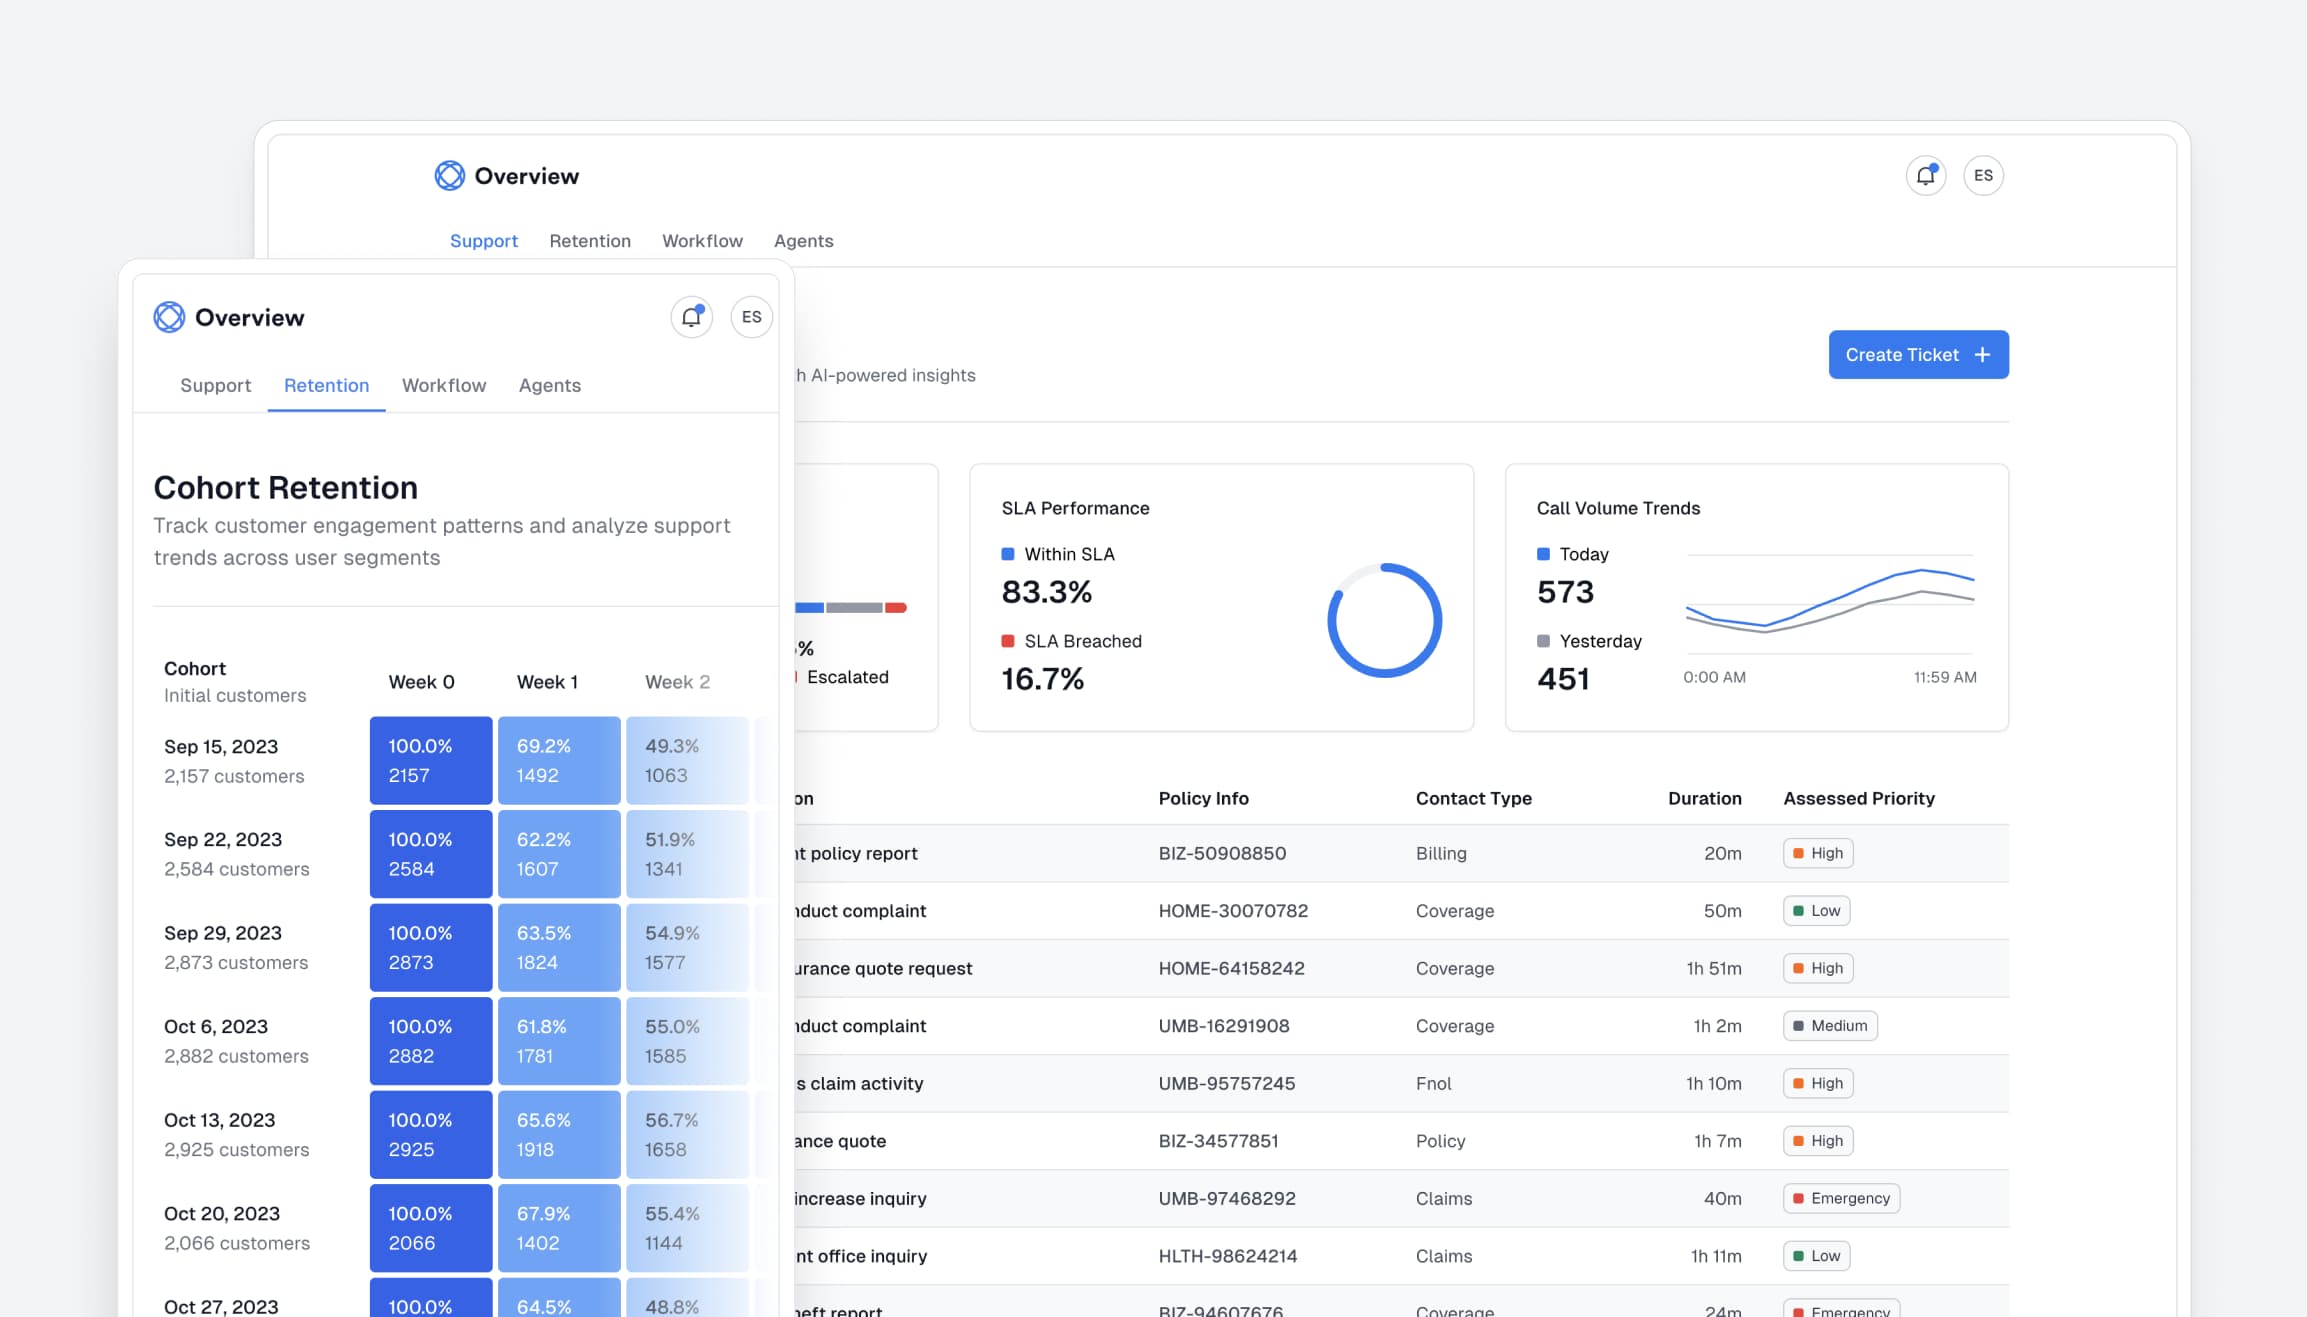
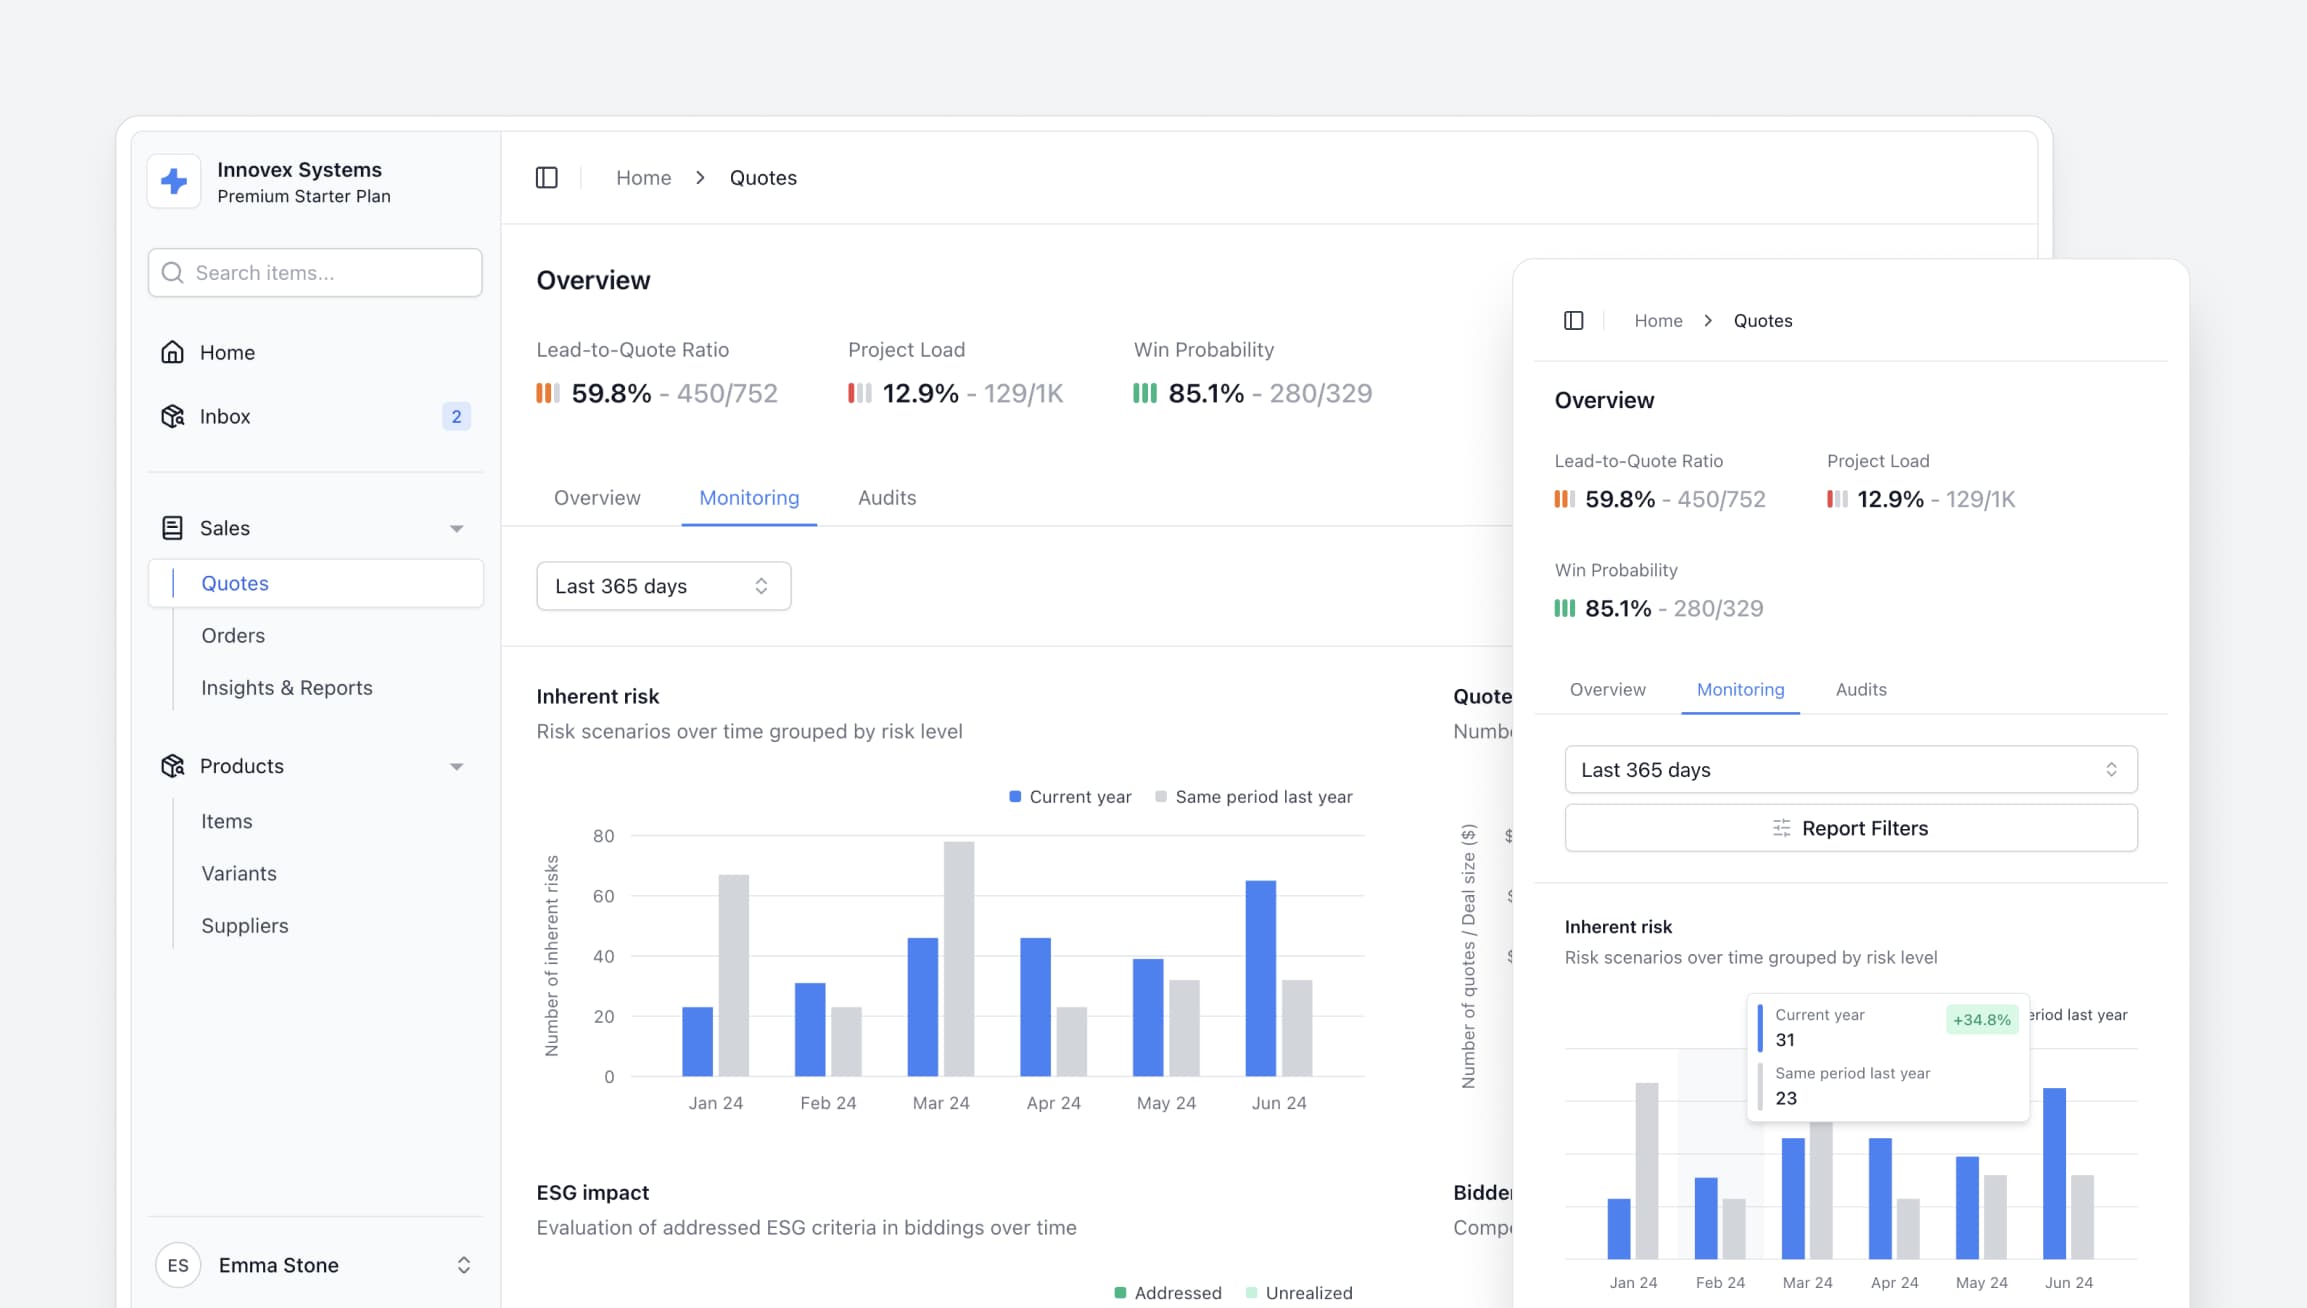
Advanced visualizations
Tracker, Bar Lists, and many more components to visualize complex use cases gracefully.
Tremor Blocks & Templates
Production-ready templates to launch tomorrow
Carefully crafted templates built by experts with the latest technology stack based on React and Next.js. Get templates for anything to build and launch your idea.Carefully crafted templates built by experts with the latest technology stack based on React and Next.js. Get templates for anything to build and launch your idea.
Dashboard Template
Analytical interfaces that allow your audience to better understand their data. Drive revenue and provide an advanced data visualization experience.

SaaS Marketing Website
Launch your next idea with a beautiful website template.
Report Pages
Overview dashboard pages to summarize data.
SaaS Template
Feed and track your data in the best way possible. Everything you need to build your first data application.

One-Pager Website
Launch your next idea with a beautiful website template. Delight in beautifully crafted illustrations, already built with Tailwind CSS v4.
Dashboard Template
Simple interfaces designed to present data easily.
Customer voices on X (formely twitter)
Leading developers build with Tremor
Tremor makes it so easy to build beautiful dashboards. The ReactJS / Next.js ecosystem just keeps getting better and better.
 CEO @ Vercel
tremor.so is dope
 Co-Founder @ Cal.com
Made quite some progress in the last week. Huge thanks @tremorlabs for saving me weeks of creating custom components.
 Senior Software Engineer @ Sonic
Love how clean the dashboard library from @tremorlabs is.
 Senior Software Engineer @ Stripe
We've loved working with the @tremorlabs team and contributing to the project. It's moving fast and they're releasing really meaningful changes. We expect to continue working with Tremor on additional starter kits like this one.
 Data platform provider
Creating dashboards quickly with @tremorlabs
 Sales Engineering Manager @ Vercel
I am in love with the @tremorlabs viz library & we've been working to adopt it in our Starter Kits.
 DevRel Lead @ Tinybird
Tremor looks interesting. Cool React components to build dashboards tremor.so
 Creator of Bootcamp.dev
Fantastic set of UI modular components @tremorlabs to build dashboards with React. It comes with pre-built modular KPI cards.
 Founder @ Katanaml.io
Super excited to see the Tremor release, Looking forward to using it in my side projects and maybe internally at Mentimeter :) it looks fantastic
 Engineering Manager @ Mentimeter
Get started in seconds
Copy-and-paste or NPM package? We have it.
// Tremor DonutChart [v0.0.0]
import React from "react"import {  Pie,  PieChart as ReChartsDonutChart,  ResponsiveContainer,  Sector,  Tooltip,} from "recharts"
import {  AvailableChartColors,  AvailableChartColorsKeys,  constructCategoryColors,  getColorClassName,} from "@/lib/chartUtils"import { cx } from "@/lib/utils"
const sumNumericArray = (arr: number[]): number =>  arr.reduce((sum, num) => sum + num, 0)
const parseData = (  data: Record<string, any>[],  categoryColors: Map<string, AvailableChartColorsKeys>,  category: string,) =>  data.map((dataPoint) => ({    ...dataPoint,    color: categoryColors.get(dataPoint[category]) || AvailableChartColors[0],    className: getColorClassName(      categoryColors.get(dataPoint[category]) || AvailableChartColors[0],      "fill",    ),  }))
const calculateDefaultLabel = (data: any[], valueKey: string): number =>  sumNumericArray(data.map((dataPoint) => dataPoint[valueKey]))
const parseLabelInput = (  labelInput: string | undefined,  valueFormatter: (value: number) => string,  data: any[],  valueKey: string,): string => labelInput || valueFormatter(calculateDefaultLabel(data, valueKey))
//#region Tooltip
type TooltipProps = Pick<ChartTooltipProps, "active" | "payload">
type PayloadItem = {  category: string  value: number  color: AvailableChartColorsKeys}
interface ChartTooltipProps {  active: boolean | undefined  payload: PayloadItem[]  valueFormatter: (value: number) => string}
const ChartTooltip = ({  active,  payload,  valueFormatter,}: ChartTooltipProps) => {  if (active && payload && payload.length) {    return (      <div        className={cx(          // base          "rounded-md border text-sm shadow-md",          // border color          "border-gray-200 dark:border-gray-800",          // background color          "bg-white dark:bg-gray-950",        )}      >        <div className={cx("space-y-1 px-4 py-2")}>          {payload.map(({ value, category, color }, index) => (            <div              key={`id-${index}`}              className="flex items-center justify-between space-x-8"            >              <div className="flex items-center space-x-2">                <span                  aria-hidden="true"                  className={cx(                    "size-2 shrink-0 rounded-full",                    getColorClassName(color, "bg"),                  )}                />                <p                  className={cx(                    // base                    "whitespace-nowrap text-right",                    // text col dark:text-gray-500or                    "text-gray-700 dark:text-gray-300",                  )}                >                  {category}                </p>              </div>              <p                className={cx(                  // base                  "whitespace-nowrap text-right font-medium tabular-nums",                  // text color                  "text-gray-900 dark:text-gray-50",                )}              >                {valueFormatter(value)}              </p>            </div>          ))}        </div>      </div>    )  }  return null}
const renderInactiveShape = (props: any) => {  const { cx, cy, innerRadius, outerRadius, startAngle, endAngle, className } =    props
  return (    <Sector      cx={cx}      cy={cy}      innerRadius={innerRadius}      outerRadius={outerRadius}      startAngle={startAngle}      endAngle={endAngle}      className={className}      fill=""      opacity={0.3}      style={{ outline: "none" }}    />  )}
type DonutChartVariant = "donut" | "pie"
type BaseEventProps = {  eventType: "sector"  categoryClicked: string  [key: string]: number | string}
type DonutChartEventProps = BaseEventProps | null | undefined
interface DonutChartProps extends React.HTMLAttributes<HTMLDivElement> {  data: Record<string, any>[]  category: string  value: string  colors?: AvailableChartColorsKeys[]  variant?: DonutChartVariant  valueFormatter?: (value: number) => string  label?: string  showLabel?: boolean  showTooltip?: boolean  onValueChange?: (value: DonutChartEventProps) => void  tooltipCallback?: (tooltipCallbackContent: TooltipProps) => void  customTooltip?: React.ComponentType<TooltipProps>}
const DonutChart = React.forwardRef<HTMLDivElement, DonutChartProps>(  (    {      data = [],      value,      category,      colors = AvailableChartColors,      variant = "donut",      valueFormatter = (value: number) => value.toString(),      label,      showLabel = false,      showTooltip = true,      onValueChange,      tooltipCallback,      customTooltip,      className,      ...other    },    forwardedRef,  ) => {    const CustomTooltip = customTooltip    const [activeIndex, setActiveIndex] = React.useState<number | undefined>(      undefined,    )    const isDonut = variant === "donut"    const parsedLabelInput = parseLabelInput(label, valueFormatter, data, value)
    const categories = Array.from(new Set(data.map((item) => item[category])))    const categoryColors = constructCategoryColors(categories, colors)
    const prevActiveRef = React.useRef<boolean | undefined>(undefined)    const prevCategoryRef = React.useRef<string | undefined>(undefined)
    const handleShapeClick = (      data: any,      index: number,      event: React.MouseEvent,    ) => {      event.stopPropagation()      if (!onValueChange) return
      if (activeIndex === index) {        setActiveIndex(undefined)        onValueChange(null)      } else {        setActiveIndex(index)        onValueChange({          eventType: "sector",          categoryClicked: data.payload[category],          ...data.payload,        })      }    }
    return (      <div ref={forwardedRef} className={cx("h-40 w-40", className)} {...other}>        <ResponsiveContainer className="size-full">          <ReChartsDonutChart            onClick={              onValueChange && activeIndex !== undefined                ? () => {                    setActiveIndex(undefined)                    onValueChange(null)                  }                : undefined            }            margin={{ top: 0, left: 0, right: 0, bottom: 0 }}          >            {showLabel && isDonut && (              <text                className="fill-gray-700 dark:fill-gray-300"                x="50%"                y="50%"                textAnchor="middle"                dominantBaseline="middle"              >                {parsedLabelInput}              </text>            )}            <Pie              className={cx(                "stroke-white dark:stroke-gray-950 [&_.recharts-pie-sector]:outline-hidden",                onValueChange ? "cursor-pointer" : "cursor-default",              )}              data={parseData(data, categoryColors, category)}              cx="50%"              cy="50%"              startAngle={90}              endAngle={-270}              innerRadius={isDonut ? "75%" : "0%"}              outerRadius="100%"              stroke=""              strokeLinejoin="round"              dataKey={value}              nameKey={category}              isAnimationActive={false}              onClick={handleShapeClick}              activeIndex={activeIndex}              inactiveShape={renderInactiveShape}              style={{ outline: "none" }}            />            {showTooltip && (              <Tooltip                wrapperStyle={{ outline: "none" }}                isAnimationActive={false}                content={({ active, payload }) => {                  const cleanPayload = payload                    ? payload.map((item: any) => ({                        category: item.payload[category],                        value: item.value,                        color: categoryColors.get(                          item.payload[category],                        ) as AvailableChartColorsKeys,                      }))                    : []
                  const payloadCategory: string = cleanPayload[0]?.category
                  if (                    tooltipCallback &&                    (active !== prevActiveRef.current ||                      payloadCategory !== prevCategoryRef.current)                  ) {                    tooltipCallback({                      active,                      payload: cleanPayload,                    })                    prevActiveRef.current = active                    prevCategoryRef.current = payloadCategory                  }
                  return showTooltip && active ? (                    CustomTooltip ? (                      <CustomTooltip active={active} payload={cleanPayload} />                    ) : (                      <ChartTooltip                        active={active}                        payload={cleanPayload}                        valueFormatter={valueFormatter}                      />                    )                  ) : null                }}              />            )}          </ReChartsDonutChart>        </ResponsiveContainer>      </div>    )  },)
DonutChart.displayName = "DonutChart"
export { DonutChart, type DonutChartEventProps, type TooltipProps }
Tremor copy-and-paste
Full customization with our copy-and-paste React components.
35+
Unique Components
300+
Block examples
import { DonutChart } from '@tremor/react';
export function DonutChartUsageExample() {  return (    <DonutChart      data={sales}      category="sales"      index="name"      valueFormatter={valueFormatter}      colors={['blue', 'cyan', 'indigo', 'violet', 'fuchsia']}      className="w-40"    />  );}
NPM Package
Get started quickly with a basic set of importable components.
15K+
Stargazers on GitHub
300K+
Monthly downloads